Taxi vs Ride Sharing: 2025 Price & Data Comparison
A data-driven comparison for 2025
Many travelers ask whether Uber is cheaper than a taxi, especially during peak hours and airport trips. Urban transportation has transformed dramatically over the last decade. Traditional taxis once dominated city streets. Today, ride-hailing platforms such as Uber and Lyft complete the majority of private on-demand trips in major U.S. cities.
Using public datasets, regulatory frameworks, and industry reporting, this guide compares traditional taxis and ride-sharing in 2025 and shows how these differences translate into real-world fare outcomes.
TaxiFare publishes city-specific fare analyses based on official tariff rules (when available) and observed ride-sharing samples. This article connects high-level trends with city-level pricing examples.
Usage statistics: 2025 market reality
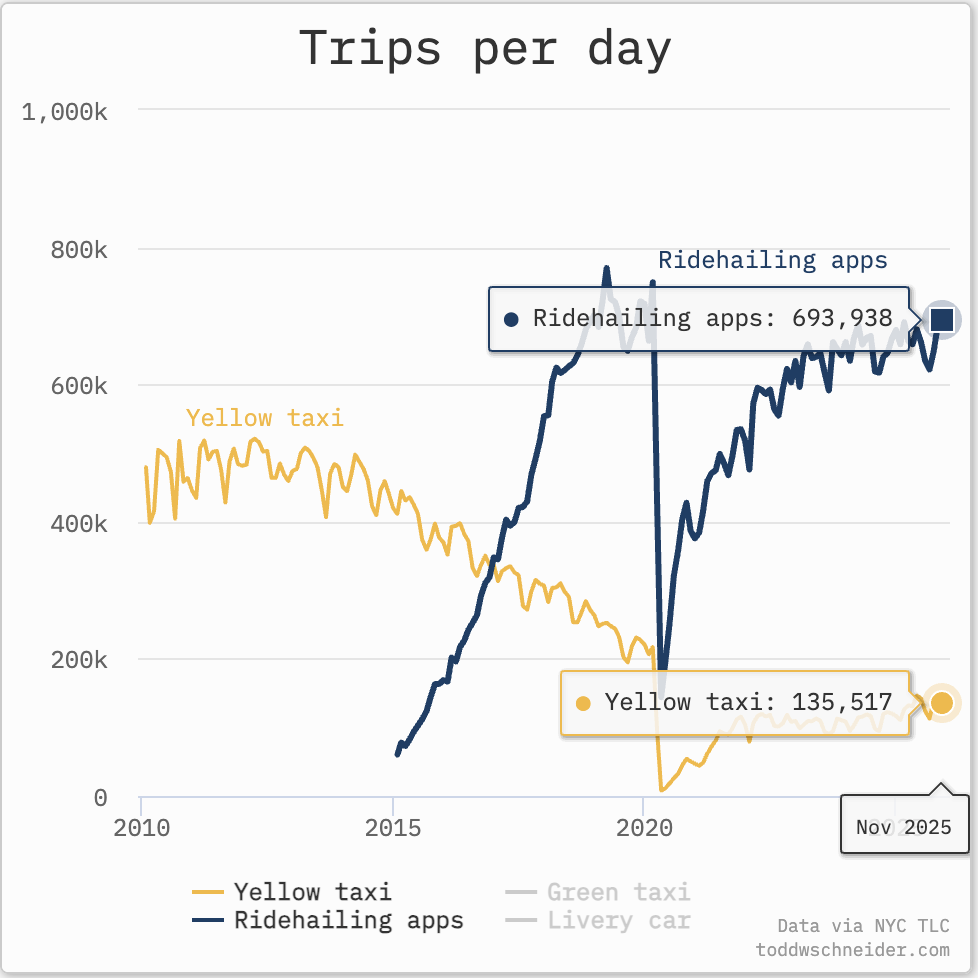
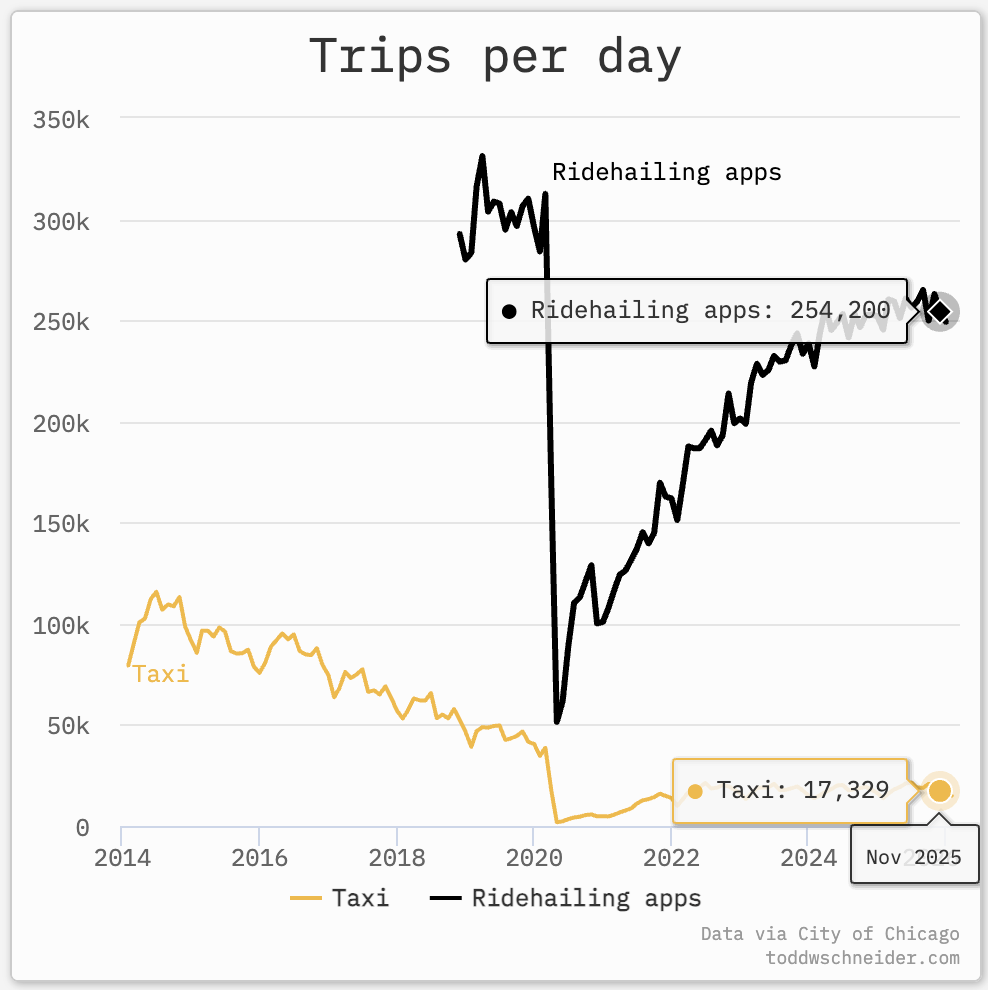
Public datasets show how dramatically ride-hailing has reshaped urban mobility in major U.S. cities.
| City (month) | Ride-hailing trips | Taxi trips | What it suggests |
|---|---|---|---|
|
New York City November 2025 |
~693,938 | ~135,517 | Ride-hailing completes >5× the daily trips of yellow taxis. |
|
Chicago December 2025 |
~254,200 | ~14,935 | Ride-hailing completes >17× the daily trips of taxis. |
These figures reflect a structural market shift rather than a temporary trend. See the full city breakdowns on TaxiFare: New York City, Chicago.
Pricing models: metered vs dynamic
Pricing is one of the most searched questions when comparing taxis and ride-sharing. The difference comes down to how prices are set and how much they can change after you start traveling.
| Traditional taxis (regulated) | Ride-sharing (dynamic) |
|---|---|
| Municipal fare rules and approved surcharges | Real-time pricing based on demand and driver availability |
| Base fare + distance/time components | Algorithm-driven upfront estimates that can spike during peaks |
| Predictable within one city’s tariff framework | More variability (surge/peak pricing, supply constraints) |
| Some routes may have regulated flat rates (e.g., airport) | Airport pricing can vary significantly by demand conditions |
Example: NYC fare rules are published by the NYC Taxi & Limousine Commission (TLC), including the initial charge and surcharges. See the official TLC taxi fare page for details.
Real-world example: New York City (city-level pricing)
In New York City, regulated taxi fares and ride-sharing pricing illustrate how these two systems differ in practice. For a typical in-city trip (around 4 miles, around 18 minutes), TaxiFare’s estimates often put taxis in a range where surcharges, traffic, and variability matter.
- Taxi estimate (range) $25.20 - $35.00
- Ride-sharing (standard, typical) ~$25.66
- Ride-sharing (peak demand) $30 - $38
Ride-sharing may rise during peak hours due to surge/peak pricing. Taxi totals can vary due to traffic, waiting time, tolls, and surcharges.
JFK ↔ Manhattan taxi trips use a regulated flat fare (excluding tolls and applicable surcharges), which provides a predictable base price regardless of traffic conditions.
Airport pricing differences
Airport trips often highlight the clearest contrast between pricing models. Flat fares (where they exist) reduce uncertainty, while demand-based pricing can swing widely during busy travel windows.
- JFK Airport: taxi flat fare applies between Manhattan and JFK. JFK fare page
- LaGuardia (LGA): metered taxi pricing applies; ride-sharing remains demand-based. LGA fare page
- Newark (EWR): interstate pricing structures apply; ride-sharing can vary significantly. EWR fare page
If you’re traveling during peak hours, compare both options before you ride: TaxiFare calculator.
Regulatory framework
Traditional taxi regulation
Taxis typically operate under strict municipal oversight, including professional licensing, vehicle inspections, insurance requirements, and fare controls.
- Professional licensing
- Vehicle inspections
- Insurance requirements
- Fare control and published tariffs
- Permit/medallion systems (in some cities)
Example regulator: NYC TLC publishes official taxi fare information and surcharges.
Ride-sharing regulation
Ride-sharing companies typically operate under Transportation Network Company (TNC) rules. Driver classification and labor policy remain active topics in many jurisdictions.
Economic Impact: Why These Systems Behave Differently
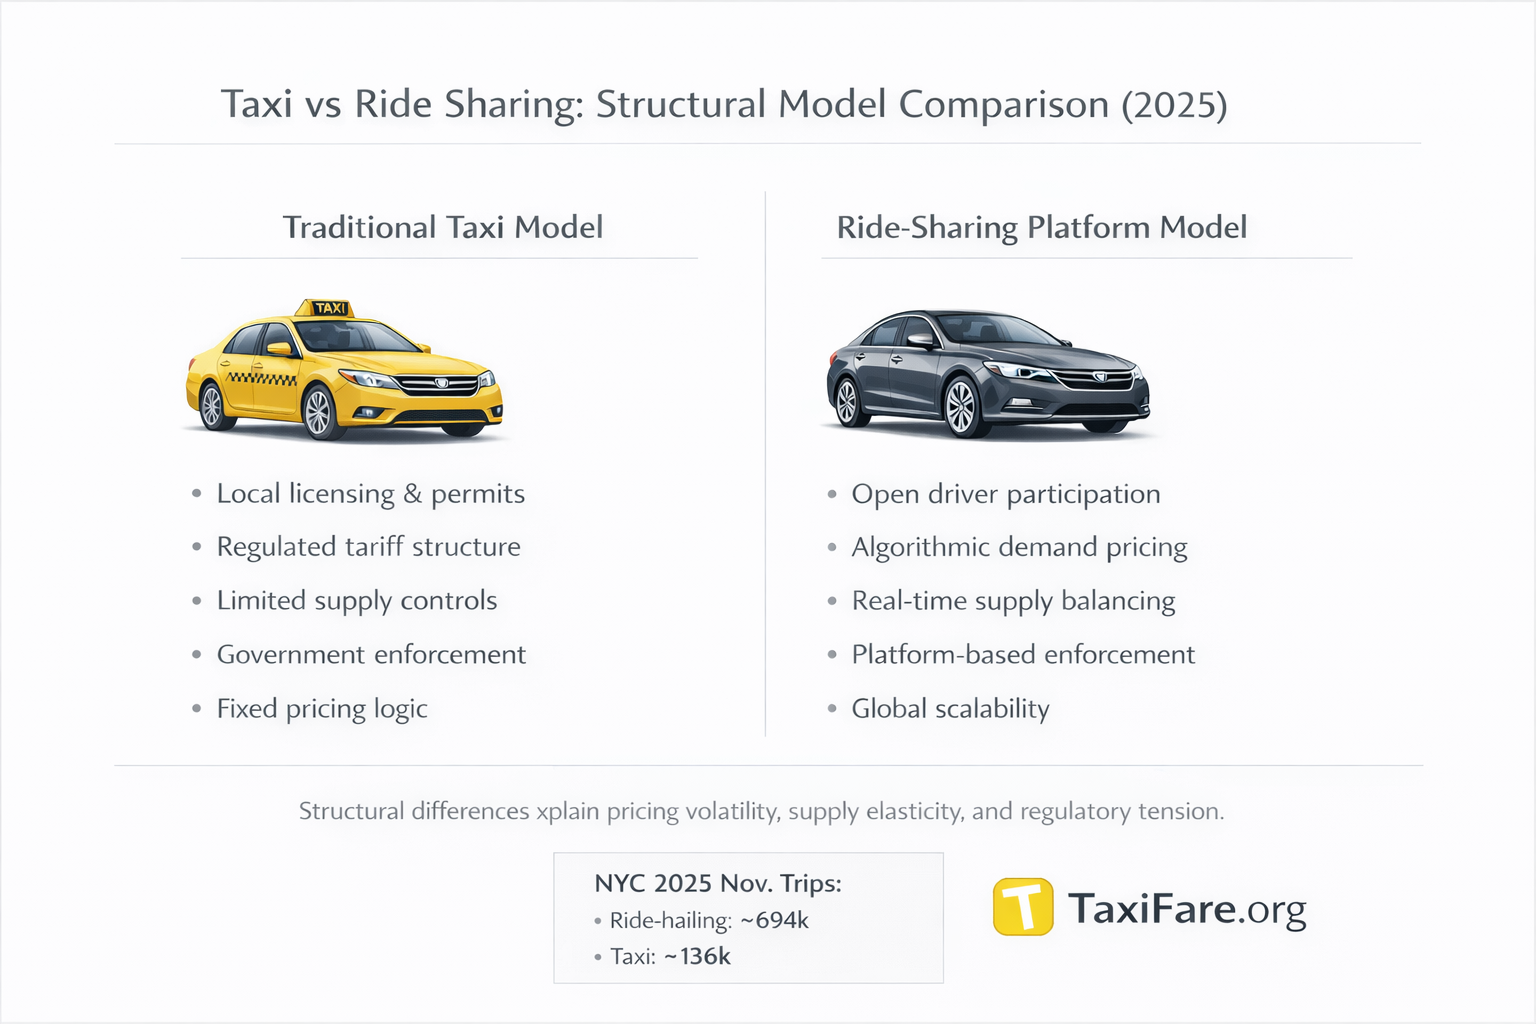
Traditional taxis and ride-sharing platforms operate under fundamentally different economic structures. These structural differences explain why pricing, regulation, and market behavior diverge so significantly.
Traditional Taxis: Regulated Local Markets
Taxi systems are typically organized around city-level licensing frameworks designed to control supply and protect consumers. In many cities this includes medallion systems, municipal permits, and regulated fare structures approved by local authorities.
- Limited or controlled vehicle supply through permits or medallions
- Municipally regulated fare structures
- Local licensing revenue and compliance oversight
- Fixed tariff components such as base fare, distance, time, and surcharges
Because market entry is controlled and fares are standardized, taxi systems tend to prioritize predictability, regulatory compliance, and long-term stability rather than rapid scaling. Revenue flows are largely local and tied to inspection systems, licensing fees, and municipal oversight.
Ride Sharing: Platform-Based Global Scaling
Ride-sharing platforms operate on a fundamentally different model built around network scale and algorithmic coordination rather than local supply controls.
- Open or semi-open driver participation models
- Dynamic demand-based pricing
- Centralized digital platform infrastructure
- Algorithmic balancing of supply and demand
Instead of regulating entry through permits, ride-sharing platforms use pricing incentives to influence driver availability. When demand rises, surge pricing increases fares, which attracts additional drivers until market balance is restored.
This approach prioritizes real-time elasticity, network growth, and geographic expansion. Because these companies operate across cities and countries, their economics are shaped by global scale, data optimization, and capital markets rather than municipal licensing systems.
Why Pricing Behaves Differently
The difference in economic architecture explains why taxis generally use fixed meter rates while ride-sharing relies on dynamic pricing. Taxi supply may feel constrained but stable, whereas ride-sharing availability fluctuates more but adjusts faster.
These models respond differently to rush hour demand, bad weather, public events, airport surges, and transit disruptions — often producing very different fares under identical traffic conditions.
Academic Perspective on Efficiency
Academic research has also examined structural efficiency differences between taxis and ride-sharing platforms. A 2016 study published in the American Economic Review found that ride-sharing vehicles achieved significantly higher utilization rates than traditional taxis, largely due to algorithmic dispatch systems and flexible driver participation.
Cramer, J., & Krueger, A. (2016). Disruptive Change in the Taxi Business: The Case of Uber. American Economic Review. View study
This efficiency gap helps explain why ride-sharing platforms rely on dynamic pricing rather than fixed tariffs: higher utilization enables real-time supply adjustments, while traditional taxi systems depend on regulated rate structures and controlled market entry.
Scale & Market Concentration
Public financial reporting and industry statistics show that ride-sharing platforms now operate at massive scale compared to most municipal taxi systems, with billions of annual trips and tens of millions of active users worldwide.
This scale enables heavy investment in data science, route optimization, algorithmic pricing, and expansion into adjacent sectors such as delivery and logistics. Traditional taxi systems, by contrast, remain primarily city-bound services focused on regulated passenger transport.
For readers interested in deeper industry context and supporting data, see the statistics and financial reporting sources listed in the references section below.
User Experience: Where the Models Diverge Most
While pricing and regulation define each system’s structure, user experience is where passengers feel the difference most clearly.
Convenience & Access
Traditional taxis can be hailed on the street in dense urban areas or booked via dispatch. Availability depends on vehicle density — strong in business districts and airports, weaker in lower-density neighborhoods.
Ride-sharing platforms operate through app-based dispatch systems. Riders can request a vehicle from almost anywhere within service boundaries, receive estimated arrival times, and track the vehicle in real time.
- Taxis: rely on physical vehicle presence
- Ride-sharing: relies on digital dispatch visibility
Cost Transparency
Taxi fares follow regulated meter structures. Riders may not know the exact final amount upfront, but pricing rules are standardized and predictable within the city.
Ride-sharing platforms display an upfront fare estimate before booking. However, prices may fluctuate due to demand-based algorithms.
- Taxis → predictable structure, limited upfront certainty
- Ride-sharing → upfront estimate, but variable pricing behavior
Safety & Oversight
Taxi systems are governed by municipal regulators such as the New York City Taxi & Limousine Commission .
Requirements typically include licensing, inspections, insurance, and fare oversight.
Ride-sharing platforms implement digital identity verification, in-app tracking, rating systems, and emergency features.
- Taxis rely primarily on government enforcement
- Ride-sharing relies on platform monitoring systems
Service Quality & Feedback Loops
Traditional taxis operate under municipal compliance standards. Ride-sharing platforms incorporate real-time passenger feedback systems where driver ratings influence platform access.
This creates continuous performance evaluation and market-driven quality enforcement.
Technology: Infrastructure vs Platform
Technology is not simply a feature difference — it is the foundation of each system.
Traditional Taxis
Modern taxi fleets increasingly incorporate GPS navigation, card payments, and app dispatch in some cities. However, technology is typically layered on top of existing regulatory frameworks.
Ride Sharing
Ride-sharing platforms were built around digital infrastructure from the start, including GPS tracking, automated payments, algorithmic routing, and demand forecasting.
This platform-first architecture enables rapid scaling, real-time pricing, and cross-market deployment. The core distinction is not digital payments — it is algorithmic coordination at scale.
Environmental Impact: Complex & Still Evolving
Environmental outcomes depend heavily on policy, electrification adoption, and ride pooling usage.
Traditional Taxis
Some cities mandate hybrid or electric taxi fleets as part of emissions policy.
Ride Sharing
Ride-sharing companies have announced electrification targets and sustainability initiatives.
Uber Sustainability • Lyft Sustainability
Ride pooling can reduce per-passenger emissions, but research suggests ride-sharing may increase total vehicle miles traveled in dense cities if pooling adoption is low.
Academic Research Perspective
A 2018 report by transportation researcher Bruce Schaller found that ride-hailing increased vehicle miles traveled in several major U.S. cities, particularly where pooling adoption was limited.
Schaller, B. (2018). The New Automobility. View report
This suggests environmental outcomes are policy-dependent and behavior-dependent rather than automatic.
Comparison Table
| Category | Traditional Taxi | Ride Sharing |
|---|---|---|
| Market Structure | Locally regulated | Platform-based, global scale |
| Pricing Logic | Fixed tariff model | Algorithmic, demand-based |
| Supply Control | License or medallion limits | Dynamic driver participation |
| Booking | Street hail + dispatch | Fully app-based |
| Oversight | Government regulator | Platform + regulator |
| Feedback | Complaint-driven enforcement | Real-time rating system |
| Technology | Infrastructure layered on regulation | Technology-native model |
| Environmental Path | Policy-driven electrification | Platform sustainability targets |
| Economic Model | City-bound | Scalable multi-market |
Frequently asked questions
Is Uber cheaper than a taxi?
It depends on demand conditions. During off-peak hours, ride-sharing can be competitively priced. During high-demand periods, surge/peak pricing can make ride-sharing significantly more expensive than regulated taxi fares.
Why does Uber use surge pricing?
Surge/peak pricing is designed to balance supply and demand by encouraging more drivers to operate during busy periods.
Are taxis safer than ride-sharing?
Both taxis and ride-sharing use background checks and insurance requirements, but the enforcement model differs. Taxis are typically regulated by municipal authorities, while ride-sharing relies heavily on app-based identity, trip tracking, and rating systems.
Why are ride-sharing services more popular?
App convenience, upfront fare estimates, and broad coverage have driven adoption. Public data from NYC and Chicago shows ride-hailing completing multiple times more daily trips than traditional taxis.
How can I estimate my exact trip cost?
Use the TaxiFare calculator to estimate both taxi and ride-sharing pricing for your specific route: https://taxifare.org/calculate-fare-estimate
Sources & references
External links are provided for transparency and context. Availability and page contents may change over time.
- NYC taxi & ride-hailing usage dashboard (TLC-based aggregates): toddwschneider.com
- Chicago taxi & ride-hailing usage dashboard (Chicago open data): toddwschneider.com
- NYC TLC official taxi fare rules: nyc.gov (TLC)
- NYC rule update mentioning the JFK-Manhattan flat fare increase to $70: rules.cityofnewyork.us
- Uber dynamic pricing explainer: uber.com
- Cramer, J., & Krueger, A. (2016): aeaweb.org
- Schaller, B. (2018): schallerconsult.com
- Industry statistics (Uber): businessofapps.com
- Industry statistics (Lyft): businessofapps.com